Effective gilt for your production


LY gilt is the value proposal for producers who consider herd productivity as a main competitive advantage. Hyper-prolificacy and improved functional traits allow increasing weaned piglets per sow per year and reducing production cost.

What makes our product different from other hyper-prolific sows?

Large litters

to wean more than 40 piglets per sow per year

Improved piglet quality

increased and more uniform individual birth weight, survival rate, reduced number of defects

Increased robustness of sows

due to leg score and mortality selection traits

Better milking capacity and increased numbers of teats

continuous improvement of the functional teats quality

Selection for the important traits: Quality of piglets

Number of teats
Milking capacity
Piglet birth weight
Survival rate
Nursing & artificial lactation management
Number of teats
Milking capacity
Piglet birth weight
Survival rate
Nursing & artificial lactation management

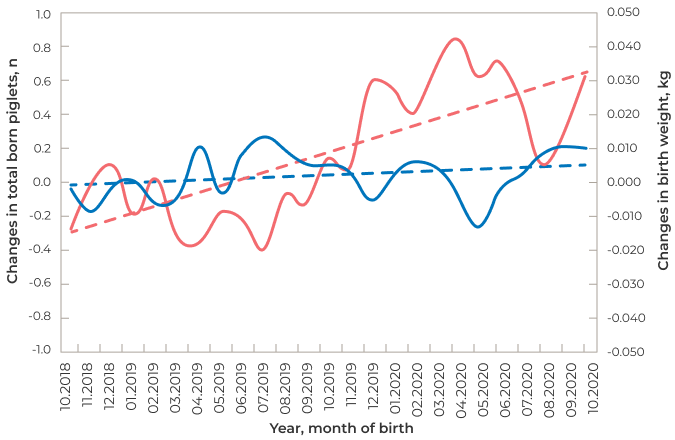
Changes in birth weights and in the numbers of born piglets since inclusion into the genetic program

Studies confirm the efficiency of the breeding program: the piglets’ birth weight and the number of piglets born demonstrate a consistent increase.

The baseline (level 0) is represented by values obtained before the elite farm inclusion in the PIC Danish Lines system. In the two years, both parameters demonstrated good and consistent trends; the solid lines designate the data of a certain month and year, and the dotted lines correspond to general trends.

Total born
Birth weight

Selection for the important traits: Sow robustness

Survival rate
Leg structure
Requirements for feeding
Heat detection
Survival rate
Leg structure
Requirements for feeding
Heat detection

Legs’ score and structure

We collect the data for taking decisions on culling and also for including it in the breeding index. Due to this approach, only robust gilts are selected to achieve a higher survival rate.

PIC Danish Lines have achieved great results in their breeding work.

The baseline (level 0) is represented by values before inclusion in the PIC Danish Lines system. In the two years, the parameter demonstrated a good and consistent trend; the solid line designates the data for a certain month and year, and the dotted line corresponds to general trends.